Baku real estate price map
Sign in to open the interactive map - live listings, the price heatmap and the tax zones.
Sign in to open the mapLive for-sale and rental listings in Baku, the average price per square metre by district, the weekly change and the tax zones - all on one interactive map. Below is a current price summary by district and what the map can do.
What's on the map
Live listings & your own area
See every active for-sale and rental listing on the map; draw your search area with a pen.
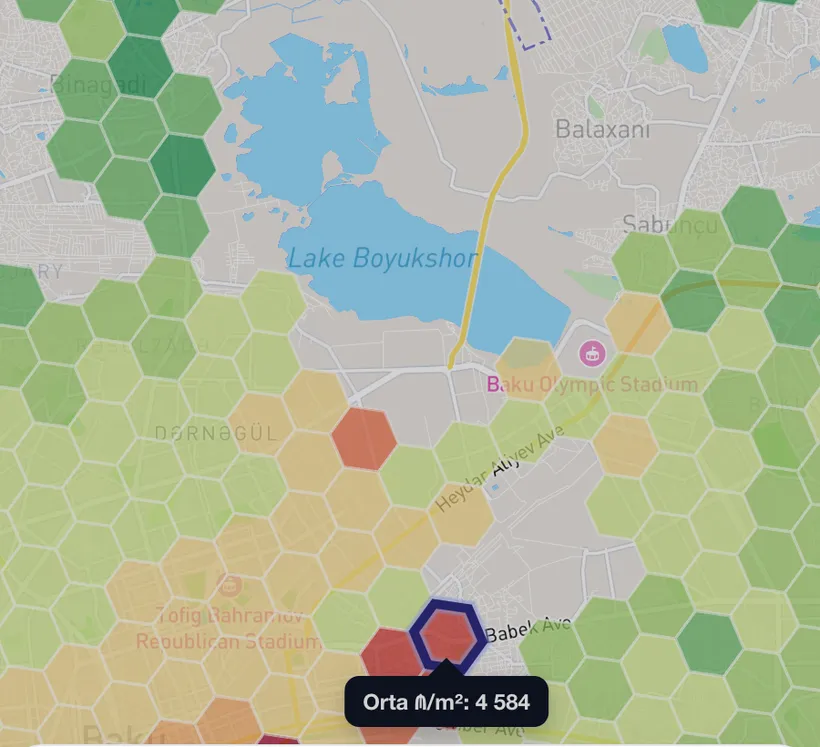
Price heatmap
The average price per m² by district and hexagon, shown in colour.
Residential complexes
Pick complexes straight from the map and see market stats and active listings.
Tax zones
Baku's 12 tax zones and the sale-tax coefficients in one tap.
My Map
Save the listings you like to your own map, with a status and private notes.
Average price by district (₼/m²)
| District | Avg ₼/m² | Weekly |
|---|---|---|
| Baku (average) | 2 437 ₼ | |
| Ağ şəhər | 4 699 ₼ | +0.1% |
| Sea Breeze | 3 923 ₼ | -0.1% |
| Nardaran | 3 910 ₼ | 0.0% |
| Sahil | 3 875 ₼ | 0.0% |
| Bakmil | 3 787 ₼ | 0.0% |
| İçəri Şəhər | 3 472 ₼ | 0.0% |
| 28 May | 3 316 ₼ | +0.1% |
| Şah İsmayıl Xətai | 3 302 ₼ | -0.1% |
| Elmlər Akademiyası | 3 242 ₼ | -0.2% |
| Nizami | 3 169 ₼ | +0.3% |
| Nəriman Nərimanov | 3 150 ₼ | -0.1% |
| Gənclik | 3 147 ₼ | +0.1% |
| Dərnəgül | 3 071 ₼ | 0.0% |
| Nərimanov | 3 066 ₼ | -0.0% |
| Nəsimi | 2 949 ₼ | +0.3% |
| Qara Qarayev | 2 903 ₼ | +0.1% |
| Koroğlu | 2 902 ₼ | +0.1% |
| 20 Yanvar | 2 885 ₼ | +0.1% |
| 8 Noyabr | 2 850 ₼ | 0.0% |
| Ulduz | 2 809 ₼ | 0.0% |
| Səbail | 2 800 ₼ | 0.0% |
| 7-ci mikrorayon | 2 791 ₼ | +0.1% |
| Yasamal | 2 786 ₼ | +0.3% |
| 8-ci mikrorayon | 2 778 ₼ | +0.2% |
| Badamdar | 2 727 ₼ | +0.0% |
| Azadlıq Prospekti | 2 667 ₼ | 0.0% |
| Bayıl | 2 667 ₼ | -0.2% |
| Neftçilər | 2 611 ₼ | +0.1% |
| Memar Əcəmi | 2 582 ₼ | +0.1% |
| 9-cu mikrorayon | 2 556 ₼ | 0.0% |
| İnşaatçılar | 2 545 ₼ | +0.2% |
| Xalqlar Dostluğu | 2 472 ₼ | -0.0% |
| Həzi Aslanov | 2 459 ₼ | +0.2% |
| Xətai | 2 437 ₼ | +0.1% |
| Şıxov | 2 412 ₼ | -1.2% |
| Əhmədli | 2 400 ₼ | 0.0% |
| 8-ci kilometr | 2 387 ₼ | +0.1% |
| Binəqədi | 2 350 ₼ | -0.2% |
| Günəşli | 2 305 ₼ | -0.3% |
| Bakıxanov | 2 298 ₼ | +0.0% |
| Yeni Yasamal | 2 278 ₼ | +0.0% |
| Sabunçu | 2 260 ₼ | 0.0% |
| Massiv D | 2 200 ₼ | 0.0% |
| Avtovağzal | 2 194 ₼ | -0.1% |
| M.Ə.Rəsulzadə | 2 180 ₼ | -0.2% |
| Massiv V | 2 167 ₼ | 0.0% |
| Yeni Günəşli | 2 150 ₼ | +0.3% |
| Köhnə Günəşli | 2 145 ₼ | +0.4% |
| Suraxanı | 2 090 ₼ | 0.0% |
| Qaraçuxur | 2 083 ₼ | 0.0% |
| Biləcəri | 2 021 ₼ | 0.0% |
| Əmircan | 2 000 ₼ | +1.5% |
| Buzovna | 1 933 ₼ | +1.8% |
| Zığ | 1 923 ₼ | +0.8% |
| Hövsan | 1 814 ₼ | +0.4% |
| Mərdəkan | 1 806 ₼ | -0.3% |
| Lökbatan | 1 701 ₼ | +0.1% |
| Abşeron | 1 579 ₼ | +0.2% |
| Masazır | 1 457 ₼ | +0.1% |
| Məmmədli | 1 437 ₼ | 0.0% |
| Binə | 1 395 ₼ | +0.6% |
| Saray | 1 387 ₼ | -0.9% |
| Pirallahı | 1 330 ₼ | +0.6% |
| Mehdiabad | 1 328 ₼ | -0.4% |
| Ceyranbatan | 1 321 ₼ | -0.6% |
| Zabrat | 1 319 ₼ | +0.9% |
| Ramana | 1 158 ₼ | -0.3% |
Updated weekly from active listings.
Tax zones
Baku is split into tax zones; the apartment sale tax is calculated with a zone coefficient (from 1.2 to 4.0).
Calculate the tax